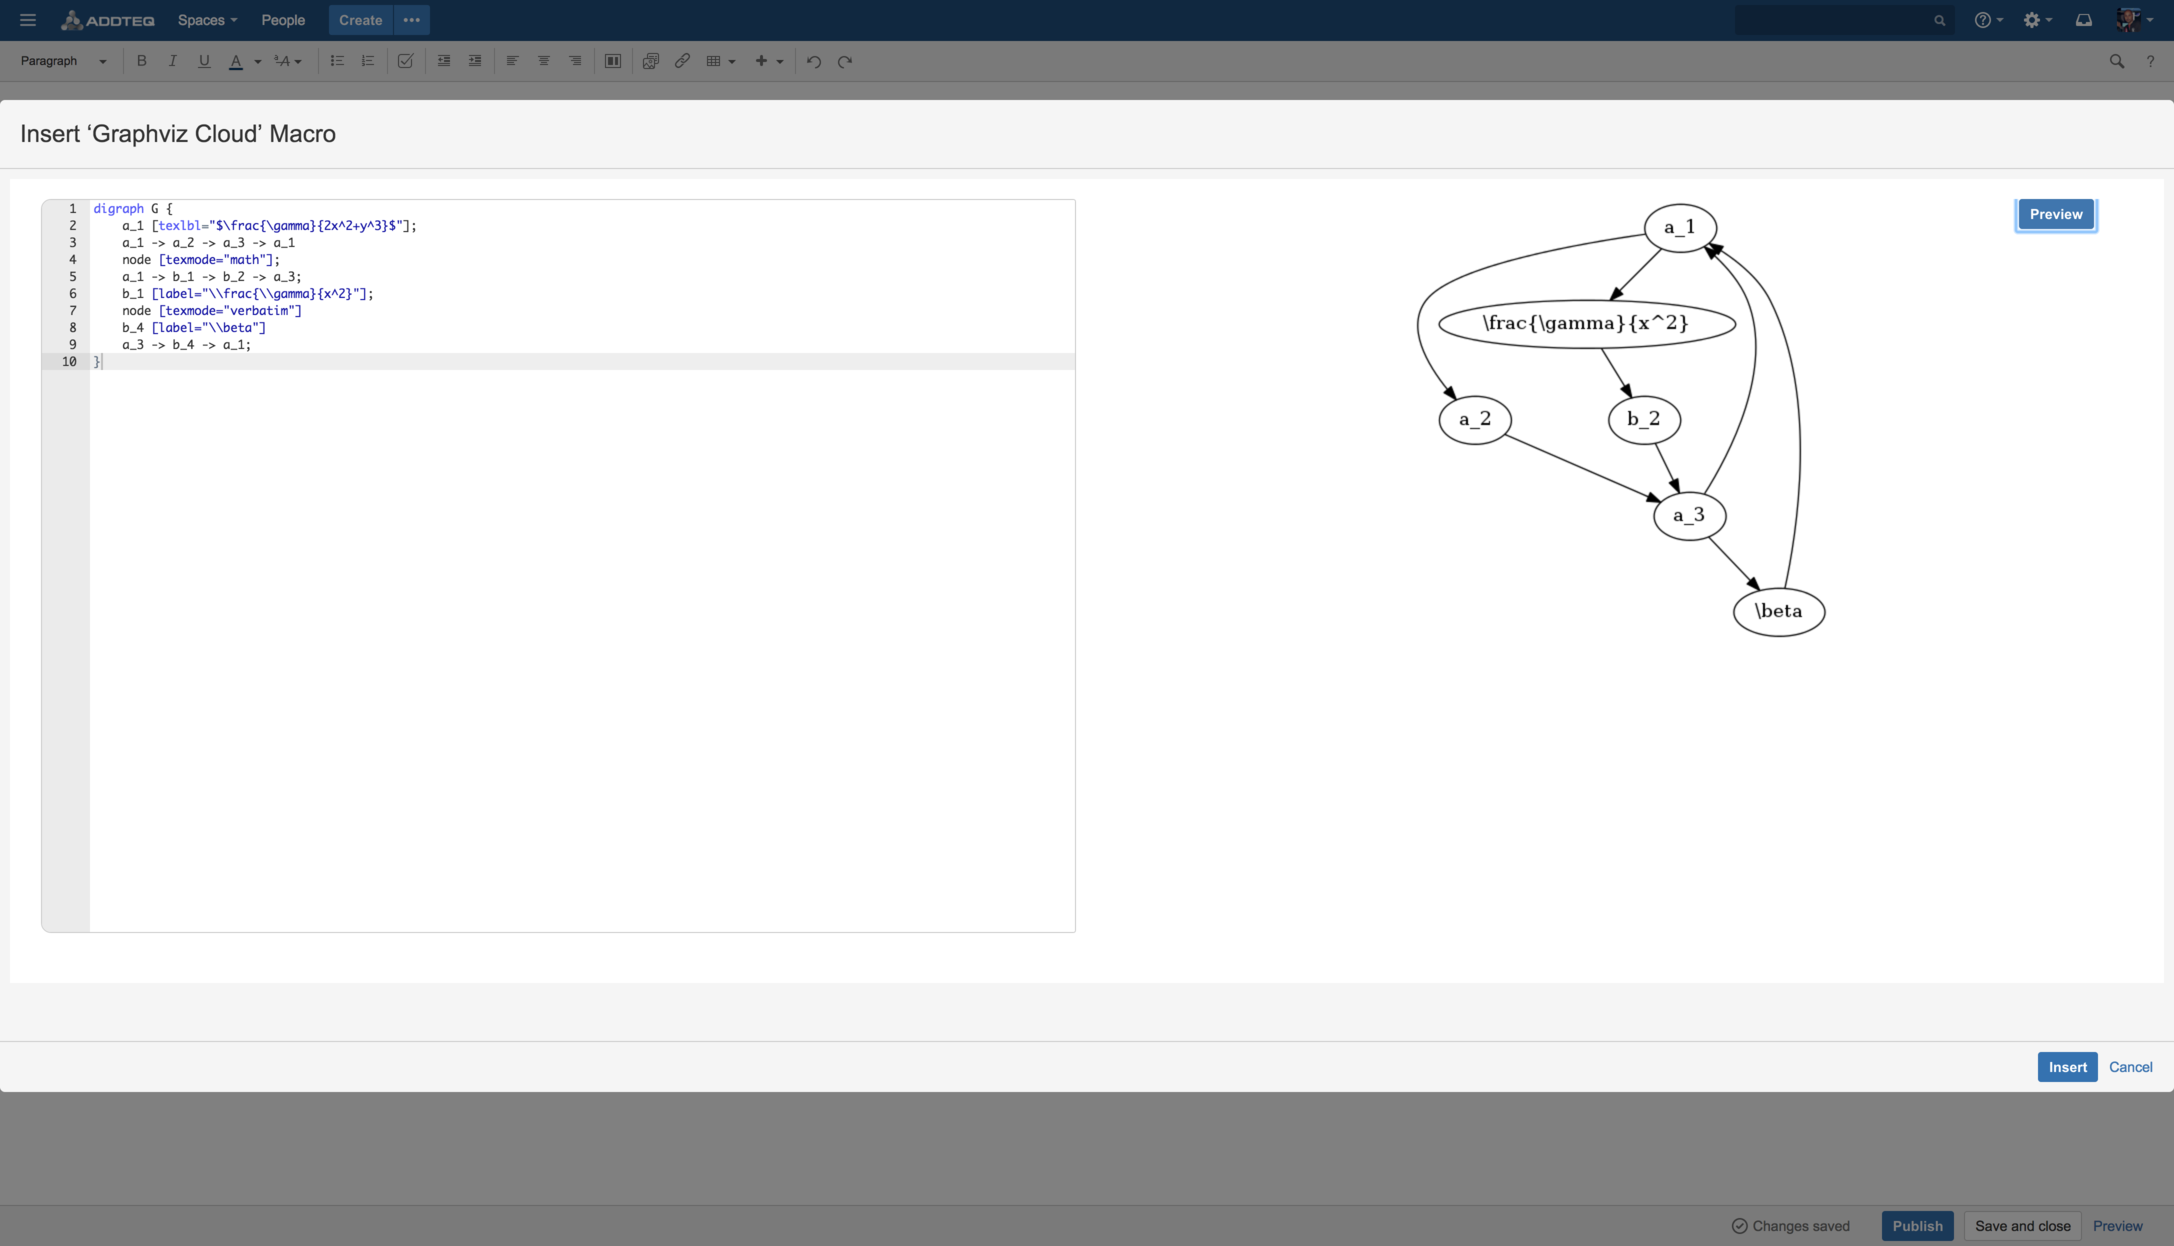
With a click of a button, users can begin writing code in Confluence documents that render into corresponding charts.
Correct Mistakes Faster
Graphviz notifies the user when there's a syntax error in the code and shows exactly where the line error was detected. Graphviz uses default style classes to move past potential blocker errors within your code.
Empower Teams
Teams are empowered to view, track, and collaborate efficiently on Confluence pages with Graphviz code and charts.
Finally, there's a way to preview your DOT code in Atlassian Confluence with Addteq's Graphviz add-on.
Graphviz, short for Graph Visualization Software, is a package of open source tools, specifically for drawing graphs in DOT scripting language. With Graphviz, you can create, edit, or share Graphviz charts directly in Confluence.